LeakCanary 是 Square 为 Android 应用提供的一个监测内存泄露的工具,可以大幅度地减少开发中遇到的内存泄露问题。
使用
依赖
dependencies {
    debugImplementation 'com.squareup.leakcanary:leakcanary-android:1.6.3'
    releaseImplementation 'com.squareup.leakcanary:leakcanary-android-no-op:1.6.3'
}
初始化
LeakCanary 在 Application 的 onCreate() 方法中初始化,代码如下:
public class BaseApplication extends Application {

    @Override
    public void onCreate() {
        super.onCreate();
        // 检查当前进程是否在HeapAnalyzerService所属进程
        if (LeakCanary.isInAnalyzerProcess(this)) {
            return;
        }
        // 开始内存泄露检测
        LeakCanary.install(this);
    }

}
首先调用 isInAnalyzerProcess() 方法来判断当前进程是否为 HeapAnalyzerService 运行的进程。这个方法会调用 LeakCanaryInternals.isInServiceProcess() 方法通过 PackageManager、ActivityManager 以及 android.os.Process 来判断当前进程是否为 HeapAnalyzerService 运行的进程,这样子做的目的是不影响主进程的使用。
清单文件
下面是 debug 生成的 AndroidManifest.xml,可以在 run 应用之后再 app/build/intermediates/instant_app_manifest/debug/ 查看:
<!-- 这个是LeakCanary分析泄露的Service -->
<service
    android:name="com.squareup.leakcanary.internal.HeapAnalyzerService"
    android:enabled="false"
    android:process=":leakcanary" />
<!-- 这个是LeakCanary展示泄露的Service -->
<service
    android:name="com.squareup.leakcanary.DisplayLeakService"
    android:enabled="false"
    android:process=":leakcanary" />
<!-- 这个是LeakCanary显示泄露信息的Activity  -->
<!-- 因为被设置为Launcher,并设置了icon,所以使用LeakCanar才会在桌面上生成icon入口的原因  -->
<activity
    android:name="com.squareup.leakcanary.internal.DisplayLeakActivity"
    android:enabled="false"
    android:icon="@mipmap/leak_canary_icon"
    android:label="@string/leak_canary_display_activity_label"
    android:process=":leakcanary"
    android:taskAffinity="com.squareup.leakcanary.com.weipin.wpstoreapp"
    android:theme="@style/leak_canary_LeakCanary.Base">
    <intent-filter>
        <action android:name="android.intent.action.MAIN" />

        <category android:name="android.intent.category.LAUNCHER" />
    </intent-filter>
</activity>
工作机制
RefWatcher.watch()创建一个KeyedWeakReference到要被监控的对象。- 然后在后台线程检查引用是否被清除,如果没有,调用
GC。 - 如果引用还是未被清除,把
heap内存dump到APP对应的文件系统中的一个.hprof文件中。 - 在另外一个进程中的
HeapAnalyzerService有一个HeapAnalyzer使用HAHA解析这个文件。 - 得益于唯一的
reference key,HeapAnalyzer找到KeyedWeakReference,定位内存泄露。 HeapAnalyzer计算 到GC roots的最短强引用路径,并确定是否是泄露。如果是的话,建立导致泄露的引用链。- 引用链传递到
APP进程中的DisplayLeakService, 并以通知的形式展示出来。
源码分析
先来看下 LeakCanary 初始化时序图: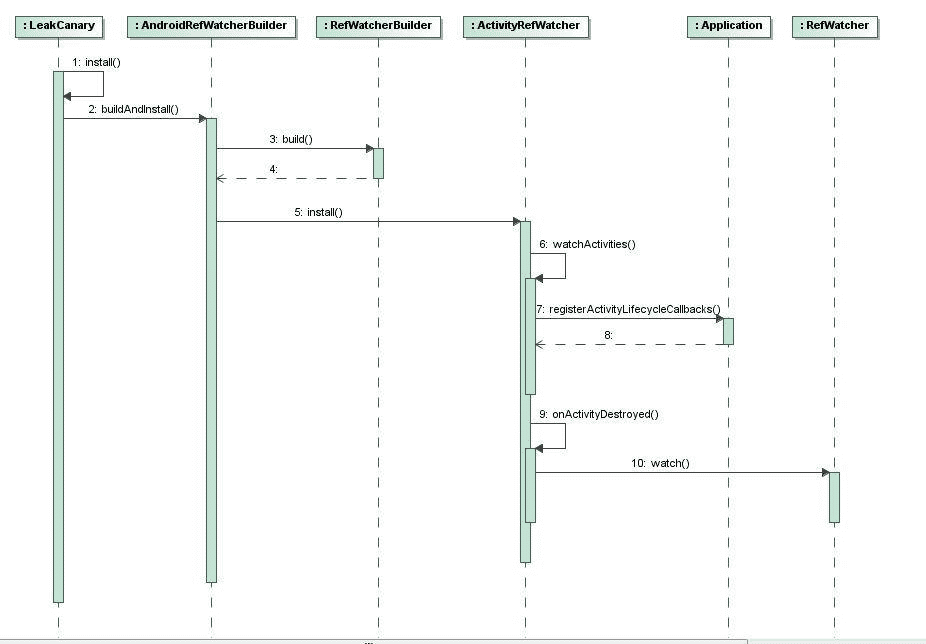
接下来将从 LeakCanary.install() 方法开始分析 LeakCanary 的工作流程。
LeakCanary.install()
public static RefWatcher install(@NonNull Application application) {
    return refWatcher(application).listenerServiceClass(DisplayLeakService.class)
            .excludedRefs(AndroidExcludedRefs.createAppDefaults().build())
            .buildAndInstall();
}
install() 方法调用 refWatcher(application) 方法返回了一个 AndroidRefWatcherBuilder 对象,通过此对象可以来配置 RefWatcher 的一些设置参数。
public static AndroidRefWatcherBuilder refWatcher(Context context) {
    return new AndroidRefWatcherBuilder(context);
}
AndroidRefWatcherBuilder.listenerServiceClass()
public AndroidRefWatcherBuilder listenerServiceClass(@NonNull Class<? extends AbstractAnalysisResultService> listenerServiceClass) {
    enableDisplayLeakActivity = DisplayLeakService.class.isAssignableFrom(listenerServiceClass);
    return heapDumpListener(new ServiceHeapDumpListener(context, listenerServiceClass));
}
此方法主要用于设置一个自定义的 AbstractAnalysisResultService 服务来监听内存分析结果。通过 ServiceHeapDumpListener 类来保存 listenerServiceClass 服务,然后再通过 RefWatcherBuilder 来保存 HeapDump的listener。
public final class ServiceHeapDumpListener implements HeapDump.Listener {

    private final Context context;
    private final Class<? extends AbstractAnalysisResultService> listenerServiceClass;

    public ServiceHeapDumpListener(@NonNull final Context context,
                                   @NonNull final Class<? extends AbstractAnalysisResultService> listenerServiceClass) {
        this.listenerServiceClass = checkNotNull(listenerServiceClass, "listenerServiceClass");
        this.context = checkNotNull(context, "context").getApplicationContext();
    }

    @Override
    public void analyze(@NonNull HeapDump heapDump) {
        checkNotNull(heapDump, "heapDump");
        HeapAnalyzerService.runAnalysis(context, heapDump, listenerServiceClass);
    }
}
可以看到,listenerServiceClass() 方法主要保存监听内存分析结果的 listener,当内存分析结果完成后,则回调该 listener,在这里这个 listener 是 DisplayLeakService 服务。
RefWatcherBuilder.excludedRefs()
public final T excludedRefs(ExcludedRefs excludedRefs) {
    heapDumpBuilder.excludedRefs(excludedRefs);
    return self();
}
由于 AndroidRefWatcherBuilder 继承自 RefWatcherBuilder,excludedRefs() 方法只在 RefWatcherBuilder 类中定义,因此调用的是 RefWatcherBuilder.excludedRefs() 方法,该方法的主要作用是告诉需要忽略哪些已知的系统泄漏 bug,避免这些结果产生干扰。
AndroidRefWatcherBuilder.buildAndInstall()
public RefWatcher buildAndInstall() {
    if (LeakCanaryInternals.installedRefWatcher != null) {
        throw new UnsupportedOperationException("buildAndInstall() should only be called once.");
    }
    RefWatcher refWatcher = build();
    if (refWatcher != DISABLED) {
        // 判断是否开启内存泄露提示
        if (enableDisplayLeakActivity) {
            LeakCanaryInternals.setEnabledAsync(context, DisplayLeakActivity.class, true);
        }
        // 判断是否开启Activity内存泄露检测
        if (watchActivities) {
            ActivityRefWatcher.install(context, refWatcher);
        }
        // 判断是否开启Fragment内存泄露检测
        if (watchFragments) {
            FragmentRefWatcher.Helper.install(context, refWatcher);
        }
    }
    // 复制给全局静态变量,防止二次调用
    LeakCanaryInternals.installedRefWatcher = refWatcher;
    return refWatcher;
}
该方法的主要作用是构建一个 RefWatcher 类,并判断 RefWatcher 是否可用,如果可用的话,则让泄漏通知显示服务生效,并且注册监听。
RefWatcherBuilder.build()
public final RefWatcher build() {
    // 如果禁用了,则返回
    if (isDisabled()) {
        return RefWatcher.DISABLED;
    }
    // 保留被排出系统的泄漏Bug
    if (heapDumpBuilder.excludedRefs == null) {
        heapDumpBuilder.excludedRefs(defaultExcludedRefs());
    }
    // 保存HeapDump的listener,监听内存分析结果
    HeapDump.Listener heapDumpListener = this.heapDumpListener;
    if (heapDumpListener == null) {
        heapDumpListener = defaultHeapDumpListener();
    }
    // 保存调试控制,如果是处理调试阶段,则忽略内存泄漏监控
    DebuggerControl debuggerControl = this.debuggerControl;
    if (debuggerControl == null) {
        debuggerControl = defaultDebuggerControl();
    }
    // 保存HeapDumper,如果没有定义,则使用默认的HeapDumper,为AndroidHeapDumper
    HeapDumper heapDumper = this.heapDumper;
    if (heapDumper == null) {
        heapDumper = defaultHeapDumper();
    }
    // 保存WatchExecutor,如果没有定义,则使用默认的WatchExecutor,为AndroidWatchExecutor
    WatchExecutor watchExecutor = this.watchExecutor;
    if (watchExecutor == null) {
        watchExecutor = defaultWatchExecutor();
    }
    // 保存GcTrigger,如果没有定义,则使用默认的GcTrigger,为GcTrigger.DEFAULT
    GcTrigger gcTrigger = this.gcTrigger;
    if (gcTrigger == null) {
        gcTrigger = defaultGcTrigger();
    }

    if (heapDumpBuilder.reachabilityInspectorClasses == null) {
        heapDumpBuilder.reachabilityInspectorClasses(defaultReachabilityInspectorClasses());
    }
    // 调用RefWatcher的构造方法,保留设置的参数
    return new RefWatcher(watchExecutor, debuggerControl, gcTrigger, heapDumper, heapDumpListener,
            heapDumpBuilder);
}

RefWatcher(WatchExecutor watchExecutor, DebuggerControl debuggerControl, GcTrigger gcTrigger,
           HeapDumper heapDumper, HeapDump.Listener heapdumpListener,
           HeapDump.Builder heapDumpBuilder) {
    this.watchExecutor = checkNotNull(watchExecutor, "watchExecutor");
    this.debuggerControl = checkNotNull(debuggerControl, "debuggerControl");
    this.gcTrigger = checkNotNull(gcTrigger, "gcTrigger");
    this.heapDumper = checkNotNull(heapDumper, "heapDumper");
    this.heapdumpListener = checkNotNull(heapdumpListener, "heapdumpListener");
    this.heapDumpBuilder = heapDumpBuilder;
    // 持有待检测内存泄露引用的key,这里使用CopyOnWriteArraySet解决并发读写问题
    retainedKeys = new CopyOnWriteArraySet<>();
    // 引用队列,弱引用或软引用被GC回收后会达到此队列
    queue = new ReferenceQueue<>();
}
可以看到 build() 方法主要是根据之前设置的一些参数来构建 RefWatcher 对象,如果有参数没有初始化,则使用默认的配置参数来初始化。在 RefWatcher 中,还有两个比较关键的成员,分别是 retainedKeys 和 queue ,它们在后面判断一个对象是否泄漏将会被用到。
ActivityRefWatcher.install()
public static void install(@NonNull Context context, @NonNull RefWatcher refWatcher) {
    Application application = (Application) context.getApplicationContext();
    ActivityRefWatcher activityRefWatcher = new ActivityRefWatcher(application, refWatcher);

    application.registerActivityLifecycleCallbacks(activityRefWatcher.lifecycleCallbacks);
}
该方法首先是创建一个 ActivityRefWatcher 对象,该对象用来确保 Activity 被销毁的时候不会泄漏。然后通过 Application 注册了 ActivityRefWatcher 成员 lifecycleCallbacks 监听 Activity 生命周期回调,lifecycleCallbacks 是继承 Application.ActivityLifecycleCallbacks 的抽想类,这样就完成了 Activity 销毁时监听监听回调,并执行 Activity 内存泄露检测操作。
public final class ActivityRefWatcher {

    private final Application.ActivityLifecycleCallbacks lifecycleCallbacks =
        new ActivityLifecycleCallbacksAdapter() {

        @Override
        public void onActivityDestroyed(Activity activity) {
            refWatcher.watch(activity);
        }
    };

    private final Application application;
    private final RefWatcher refWatcher;

    private ActivityRefWatcher(Application application, RefWatcher refWatcher) {
        this.application = application;
        this.refWatcher = refWatcher;
    }

    public void watchActivities() {
        // Make sure you don't get installed twice.
        stopWatchingActivities();
        application.registerActivityLifecycleCallbacks(lifecycleCallbacks);
    }

    public void stopWatchingActivities() {
        application.unregisterActivityLifecycleCallbacks(lifecycleCallbacks);
    }
}
在 ActivityRefWatcher 中的定义的 lifecycleCallbacks 只实现了 onActivityDestroyed() 的周期回调方法,RefWatcher 的 watch() 方法是在 Activity 执行 onDestroy() 方法时被回调的。因此 ActivityRefWatcher 是在 Activity被销毁时,开始工作的,监控 Activity 是否被销毁了。
Application.registerActivityLifecycleCallbacks()
public void registerActivityLifecycleCallbacks(ActivityLifecycleCallbacks callback) {
    synchronized (mActivityLifecycleCallbacks) {
        mActivityLifecycleCallbacks.add(callback);
    }
}
public interface ActivityLifecycleCallbacks {
    void onActivityCreated(Activity activity, Bundle savedInstanceState);
    void onActivityStarted(Activity activity);
    void onActivityResumed(Activity activity);
    void onActivityPaused(Activity activity);
    void onActivityStopped(Activity activity);
    void onActivitySaveInstanceState(Activity activity, Bundle outState);
    void onActivityDestroyed(Activity activity);
}
FragmentRefWatcher.Helper.install()
public static void install(Context context, RefWatcher refWatcher) {
    List<FragmentRefWatcher> fragmentRefWatchers = new ArrayList<>();

    // 添加兼容Android O的Fragment泄露检测
    if (SDK_INT >= O) {
        fragmentRefWatchers.add(new AndroidOFragmentRefWatcher(refWatcher));
    }
    // 添加通过反射构造兼容Android O以下的Fragment泄露检测
    try {
        Class<?> fragmentRefWatcherClass = Class.forName(SUPPORT_FRAGMENT_REF_WATCHER_CLASS_NAME);
        Constructor<?> constructor =
                fragmentRefWatcherClass.getDeclaredConstructor(RefWatcher.class);
        FragmentRefWatcher supportFragmentRefWatcher =
                (FragmentRefWatcher) constructor.newInstance(refWatcher);
        fragmentRefWatchers.add(supportFragmentRefWatcher);
    } catch (Exception ignored) {
    }

    if (fragmentRefWatchers.size() == 0) {
        return;
    }

    Helper helper = new Helper(fragmentRefWatchers);
    // 注册监听Activity生命周期回调
    Application application = (Application) context.getApplicationContext();
    application.registerActivityLifecycleCallbacks(helper.activityLifecycleCallbacks);
}
上面代码实现和监听 Activity 生命周期有所差异,首先创建 FragmentRefWatcher 的容器,判断 SDK 版本是否大于等于 Android O,若大于等于则创建 AndroidOFragmentRefWatche 加入容器,然后在通过反射创建 SupportFragmentRefWatcher 也加入到容器中,之后创建 Helper 并通过 Application 注册了 Helper 成员 activityLifecycleCallbacks 监听 Activity 的生命周期,但它仅监听 Activity 的创建,下面来看看它的代码:
final class Helper {

    private final Application.ActivityLifecycleCallbacks activityLifecycleCallbacks =
        new ActivityLifecycleCallbacksAdapter() {

        @Override
        public void onActivityCreated(Activity activity, Bundle savedInstanceState) {
            for (FragmentRefWatcher watcher : fragmentRefWatchers) {
                watcher.watchFragments(activity);
            }
        }
    };

    private final List<FragmentRefWatcher> fragmentRefWatchers;

    private Helper(List<FragmentRefWatcher> fragmentRefWatchers) {
        this.fragmentRefWatchers = fragmentRefWatchers;
    }
}
通过上面的代码可以知道,这个 activityLifecycleCallbacks 在 Activity 创建时,遍历之前 FragmentRefWatcher 的 list 并调用实例中的 watchFragments(),list 只有两个对象:SupportFragmentRefWatcher(兼容Android O以下)和 AndroidOFragmentRefWatcher(兼容Android O+引入了fragment的生命周期,用户不需要在onDestroy()方法中自行调用),它们两实现差不多。这里只看 SupportFragmentRefWatcher 代码:
class AndroidOFragmentRefWatcher implements FragmentRefWatcher {

    private final RefWatcher refWatcher;

    AndroidOFragmentRefWatcher(RefWatcher refWatcher) {
        this.refWatcher = refWatcher;
    }

    private final FragmentManager.FragmentLifecycleCallbacks fragmentLifecycleCallbacks =
        new FragmentManager.FragmentLifecycleCallbacks() {

        @Override
        public void onFragmentViewDestroyed(FragmentManager fm, Fragment fragment) {
            // 在Fragment的View销毁时检测泄露
            View view = fragment.getView();
            if (view != null) {
                refWatcher.watch(view);
            }
        }

        @Override
        public void onFragmentDestroyed(FragmentManager fm, Fragment fragment) {
            // 在Fragment实例销毁时检测泄露
            refWatcher.watch(fragment);
        }
    };

    @Override
    public void watchFragments(Activity activity) {
        FragmentManager fragmentManager = activity.getFragmentManager();
        // 注册supportFragment生命周期监听
        fragmentManager.registerFragmentLifecycleCallbacks(fragmentLifecycleCallbacks, true);
    }
}
到 watchFragments() 这里发现这才和监听 Activity 生命周期相似,通过 Activity 获取 FragmentManager 注册成员 FragmentLifecycleCallbacks 监听 Fragment 销毁生命周期,然后进行内存泄露检测操作。
RefWatcher.watch()
public void watch(Object watchedReference) {
    watch(watchedReference, "");
}

public void watch(Object watchedReference, String referenceName) {
    if (this == DISABLED) {
        return;
    }
    checkNotNull(watchedReference, "watchedReference");
    checkNotNull(referenceName, "referenceName");
    // 检查泄露开始时间
    final long watchStartNanoTime = System.nanoTime();
    // 为引用生成唯一的key
    String key = UUID.randomUUID().toString();
    retainedKeys.add(key);
    // 创建一个弱引用
    final KeyedWeakReference reference =
            new KeyedWeakReference(watchedReference, key, referenceName, queue);
    // 开启异步线程分析弱引用
    ensureGoneAsync(watchStartNanoTime, reference);
}
首先会判断当前 RefWatcher 是否可用,然后对检测对象和对应的引用标识字符串判空,生成检查泄露开始时间,接下来为引用生成唯一的 key 并添加到 retainedKeys,然后创建 KeyedWeakReference 对象,开启异步线程分析弱引用。这里看看 KeyedWeakReference 代码:
final class KeyedWeakReference extends WeakReference<Object> {

    public final String key;
    public final String name;

    KeyedWeakReference(Object referent, String key, String name,
                       ReferenceQueue<Object> referenceQueue) {
        super(checkNotNull(referent, "referent"), checkNotNull(referenceQueue, "referenceQueue"));
        this.key = checkNotNull(key, "key");
        this.name = checkNotNull(name, "name");
    }
}
从上面可以看出 KeyedWeakReference 封装了引用唯一的 key 和引用标识字符串,并将检测对象的弱引用关联到 RefWatcher 的引用队列。
RefWatcher.ensureGoneAsync()
private void ensureGoneAsync(final long watchStartNanoTime, final KeyedWeakReference reference) {
    watchExecutor.execute(new Retryable() {
        @Override
        public Retryable.Result run() {
            return ensureGone(reference, watchStartNanoTime);
        }
    });
}
有上面代码看出将泄露检测转移到 WatchExecutor,而它的实现是 AndroidWatchExecutor,接下来看看它的代码:
public final class AndroidWatchExecutor implements WatchExecutor {

    static final String LEAK_CANARY_THREAD_NAME = "LeakCanary-Heap-Dump";   // 子线程名称
    private final Handler mainHandler;          // 绑定主线程的Handler
    private final Handler backgroundHandler;    // 绑定子线程的Handler
    private final long initialDelayMillis;      // 初始化延迟的毫秒数
    private final long maxBackoffFactor;        // 最大失败重试数

    public AndroidWatchExecutor(long initialDelayMillis) {
        mainHandler = new Handler(Looper.getMainLooper());
        HandlerThread handlerThread = new HandlerThread(LEAK_CANARY_THREAD_NAME);
        handlerThread.start();
        backgroundHandler = new Handler(handlerThread.getLooper());
        this.initialDelayMillis = initialDelayMillis;
        maxBackoffFactor = Long.MAX_VALUE / initialDelayMillis;
    }

    @Override
    public void execute(@NonNull Retryable retryable) {
        if (Looper.getMainLooper().getThread() == Thread.currentThread()) {
            // 主线程操作
            waitForIdle(retryable, 0);
        } else {
            // 子线程切换到主线程操作
            postWaitForIdle(retryable, 0);
        }
    }

    private void postWaitForIdle(final Retryable retryable, final int failedAttempts) {
        // 调用mainHandler将操作切换到主线程
        mainHandler.post(new Runnable() {
            @Override
            public void run() {
                waitForIdle(retryable, failedAttempts);
            }
        });
    }

    private void waitForIdle(final Retryable retryable, final int failedAttempts) {
        // This needs to be called from the main thread.(这里一定要在主线程调用)
    // 添加主线程空闲回调监听执行postToBackgroundWithDelay()
        Looper.myQueue().addIdleHandler(new MessageQueue.IdleHandler() {
            @Override
            public boolean queueIdle() {
                postToBackgroundWithDelay(retryable, failedAttempts);
                return false;
            }
        });
    }

    private void postToBackgroundWithDelay(final Retryable retryable, final int failedAttempts) {
        // 指数2增长的重试数,最大值不超过maxBackoffFactor
        long exponentialBackoffFactor = (long) Math.min(Math.pow(2, failedAttempts), maxBackoffFactor);
        // 延迟执行的时间
        long delayMillis = initialDelayMillis * exponentialBackoffFactor;
        // 切换到后台子线程执行
        backgroundHandler.postDelayed(new Runnable() {
            @Override
            public void run() {
                Retryable.Result result = retryable.run();
                // 如果返回值为RETRY时,会再次延时再次尝试执行。延迟初始时间为5s,以后每次重试时间x2
                if (result == RETRY) {
                    postWaitForIdle(retryable, failedAttempts + 1);
                }
            }
        }, delayMillis);
    }
}
AndroidWatchExecutor 的构造方法会创建主线程和和后台子线的 Handler,并初始化切换到子线程 Handler 的最大延迟时间 maxBackoffFactor 和初始化时间 initialDelayMillis,maxBackoffFactor 值为 Long.MAX_VALUE / initialDelayMillis,initialDelayMillis 值为 5(因为 AndroidWatchExecutor 是被 AndroidRefWatcherBuilder.defaultWatchExecutor() 创建)。
execute()方法中无论waitForIdle()还是postWaitForIdle(),都是需要切换到主线程执行,而且postWaitForIdle()最终切换到waitForIdle()。waitForIdle()方法监听主线程Handler消息队列空闲,只要主线程空闲就会执行postToBackgroundWithDelay()操作。postToBackgroundWithDelay()方法会就首先根据重试次数计算延迟执行的时间,然后延迟切换到子线程的Handler操作,如果Retryable.run()返回Result.RETRY时,会执行postWaitForIdle()继续等待主线程再次空闲。Retryable.run()在之前RefWatcher.ensureGoneAsync()被调用,而Retryable.run()的返回值由RefWatcher.ensureGoneAsync()返回,ensureGoneAsync()在以下的情况会返回Result.RETRY:- debug 模式启动时。
- 创建 dumpHeap 文件失败时。
- 5s后 UI 线程未空闲时。
RefWatch.ensureGone()
@SuppressWarnings("ReferenceEquality") // Explicitly checking for named null.
Retryable.Result ensureGone(final KeyedWeakReference reference, final long watchStartNanoTime) {
    long gcStartNanoTime = System.nanoTime();
    // 计算watch方法到gc垃圾回收的时长
    long watchDurationMs = NANOSECONDS.toMillis(gcStartNanoTime - watchStartNanoTime);
    // 尝试移除已经到达引用队列的弱引用
    removeWeaklyReachableReferences();
    // 判断是否在debug
    if (debuggerControl.isDebuggerAttached()) {
        // The debugger can create false leaks.(debug可以创造错误的内存泄露)
        return RETRY;
    }
    // 若当前对象已经可达了,即不会造成内存泄露
    if (gone(reference)) {
        return DONE;
    }
    // 手动gc,确保引用对象是否真的被回收了。
    // 因为在dump内存信息之前提示内存泄露的时候,希望系统经过充分gc垃圾回收,而不存在任何的误判,对leakcanary容错性的考虑
    gcTrigger.runGc();
    // 清除已经到达引用队列的弱引用
    removeWeaklyReachableReferences();
    // 此时对象还没到达队列,代表已经内存泄露了
    if (!gone(reference)) {
        long startDumpHeap = System.nanoTime();
        long gcDurationMs = NANOSECONDS.toMillis(startDumpHeap - gcStartNanoTime);
        // dump出内存泄露的heap文件,这里可能触发GC
        File heapDumpFile = heapDumper.dumpHeap();
        if (heapDumpFile == RETRY_LATER) {
            // Could not dump the heap.(不能dump heap堆文件)
            return RETRY;
        }
    // dump heap文件的时间计算
        long heapDumpDurationMs = NANOSECONDS.toMillis(System.nanoTime() - startDumpHeap);
        // 真正分析内存泄露以及路径
        HeapDump heapDump = heapDumpBuilder.heapDumpFile(heapDumpFile).referenceKey(reference.key)
                .referenceName(reference.name)
                .watchDurationMs(watchDurationMs)
                .gcDurationMs(gcDurationMs)
                .heapDumpDurationMs(heapDumpDurationMs)
                .build();

        heapdumpListener.analyze(heapDump);
    }
    return DONE;
}
该方法主要是判断内存泄露。在之前的 RefWatcher.watch() 里生成了检测引用对象的 UUID 的 key 并关联了弱引用 KeyedWeakReference 对象,弱引用与 ReferenceQueue 联合使用,如果弱引用关联的对象被回收,则会把这个弱引用加入到 ReferenceQueue 中。
removeWeaklyReachableReferences()方法尝试移除已经到达引用队列的弱引用,会对应删除KeyedWeakReference的数据。如果这个引用继续存在,那么就说明没有被回收。gone()方法查看retainedKeys是否包含KeyedWeakReference的唯一key。gcTrigger.runGc()方法手动触发 gc 操作,gcTrigger中封装了 gc 操作的代码,首先会调用Runtime.getRuntime().gc()以触发系统 gc 操作,然后当前后台子线程 sleep 100 毫秒,最后调用System.runFinalization()强制系统回收没有引用的队形,这样子确保引用对象是否真的被回收了。因为在 dump 内存信息之前提示内存泄露的时候,希望系统经过充分 gc 垃圾回收,而不存在任何的误判,这是对 LeakCanary 容错性的考虑。- 再次移除不可达引用,如果引用存在了,都没有被回收则判定内存泄露。
- 判定泄露后调用
AndroidHeapDumper.dump(),首先通过LeakDirectoryProvider的实现类DefaultLeakDirectoryProvider为.prof文件创建 File,若文件创建失败也会返回RETRY_LATER让之前的AndroidWatchExecutor.execute()等待下次主线程空闲执行,它最多创建7个文件,数目超过后,删除最早创建的文件,所有文件默认保存在Download文件夹下;然后利用CountDownLatch阻塞当前后台子线程5秒并监听主线程是否空闲,若不空闲则返回RETRY_LATER,若空闲则调用android.os.Debug.dumpHprofData()生成.prof文件。 - 调用
HeapDump.Listener分析刚生成的.prof文件。
ServiceHeapDumpListener.analyze()
public void analyze(@NonNull HeapDump heapDump) {
    checkNotNull(heapDump, "heapDump");
    HeapAnalyzerService.runAnalysis(context, heapDump, listenerServiceClass);
}
ServiceHeapDumpListener 是 HeapDump.Listener 的实现类,在 RefWatch.ensureGone() 方法中调用了它的 analyze(),主要用来分析泄露信息,找出泄露的对象的引用路径。
HeapAnalyzerService 继承抽象类 ForegroundService,而 ForegroundService 继承 IntentService,它的 runAnalysis() 方法会回调 onHandleIntent():
public final class HeapAnalyzerService extends ForegroundService
        implements AnalyzerProgressListener {

    private static final String LISTENER_CLASS_EXTRA = "listener_class_extra";
    private static final String HEAPDUMP_EXTRA = "heapdump_extra";

    public static void runAnalysis(Context context, HeapDump heapDump,
                                   Class<? extends AbstractAnalysisResultService> listenerServiceClass) {
        // 开启Service实例化
        setEnabledBlocking(context, HeapAnalyzerService.class, true);
        setEnabledBlocking(context, listenerServiceClass, true);
        // 启动前台服务
        Intent intent = new Intent(context, HeapAnalyzerService.class);
        intent.putExtra(LISTENER_CLASS_EXTRA, listenerServiceClass.getName());
        intent.putExtra(HEAPDUMP_EXTRA, heapDump);
        ContextCompat.startForegroundService(context, intent);
    }

    public HeapAnalyzerService() {
        super(HeapAnalyzerService.class.getSimpleName(), R.string.leak_canary_notification_analysing);
    }

    @Override
    protected void onHandleIntentInForeground(@Nullable Intent intent) {
        if (intent == null) {
            CanaryLog.d("HeapAnalyzerService received a null intent, ignoring.");
            return;
        }
        String listenerClassName = intent.getStringExtra(LISTENER_CLASS_EXTRA);
        HeapDump heapDump = (HeapDump) intent.getSerializableExtra(HEAPDUMP_EXTRA);
        // 创建过滤掉特定内存泄露的heapAnalyzer
        HeapAnalyzer heapAnalyzer =
                new HeapAnalyzer(heapDump.excludedRefs, this, heapDump.reachabilityInspectorClasses);
        // 检查内存泄露
        AnalysisResult result = heapAnalyzer.checkForLeak(heapDump.heapDumpFile, heapDump.referenceKey,
                heapDump.computeRetainedHeapSize);
        // 回调结果显示
        AbstractAnalysisResultService.sendResultToListener(this, listenerClassName, heapDump, result);
    }

    @Override
    public void onProgressUpdate(Step step) {
        int percent = (int) ((100f * step.ordinal()) / Step.values().length);
        CanaryLog.d("Analysis in progress, working on: %s", step.name());
        String lowercase = step.name().replace("_", " ").toLowerCase();
        String message = lowercase.substring(0, 1).toUpperCase() + lowercase.substring(1);
        showForegroundNotification(100, percent, false, message);
    }
}
HeapAnalyzer.checkForLeak()
public AnalysisResult checkForLeak(@NonNull File heapDumpFile,
                                   @NonNull String referenceKey, boolean computeRetainedSize) {
    long analysisStartNanoTime = System.nanoTime();

    if (!heapDumpFile.exists()) {
        Exception exception = new IllegalArgumentException("File does not exist: " + heapDumpFile);
        return failure(exception, since(analysisStartNanoTime));
    }

    try {
        listener.onProgressUpdate(READING_HEAP_DUMP_FILE);
        // 封装成MemoryMappedFileBuffer对象
        HprofBuffer buffer = new MemoryMappedFileBuffer(heapDumpFile);
        // 传进HprofParser解析器
        HprofParser parser = new HprofParser(buffer);
        listener.onProgressUpdate(PARSING_HEAP_DUMP);
        // 装换成Snapshot内存快照对象
        Snapshot snapshot = parser.parse();
        listener.onProgressUpdate(DEDUPLICATING_GC_ROOTS);
        // 去重复路径结果
        deduplicateGcRoots(snapshot);
        listener.onProgressUpdate(FINDING_LEAKING_REF);
        // 根据要检测的key查询解析结果中是否有需要的对象
        Instance leakingRef = findLeakingReference(referenceKey, snapshot);

        // False alarm, weak reference was cleared in between key check and heap dump.
        // (误报,弱引用在对应的KeyedWeakReference检查和heap堆文件期间被清除)
        // 引用对象不存在,说明gc时被清除
        if (leakingRef == null) {
            String className = leakingRef.getClassObj().getClassName();
            return noLeak(className, since(analysisStartNanoTime));
        }
        // 找出内存泄露的路径
        return findLeakTrace(analysisStartNanoTime, snapshot, leakingRef, computeRetainedSize);
    } catch (Throwable e) {
        return failure(e, since(analysisStartNanoTime));
    }
}
checkForLeak() 方法是 LeakCanray 最核心的方法。
引入 HAHA(Headless Android Heap Analyzer) 库(一个 heap prof 堆文件分析库),将 hprof 文件解析成内存快照 Snapshot 对象进行分析。
deduplicateGcRoots() 方法使用 jetBrains 的 THashMap(THashMap 的内存占用量比 HashMap 小)做中转,去掉 snapshot 中 GCRoot 的重复路径,以减少内存压力。
HeapAnalyzer.findLeakingReference()
private Instance findLeakingReference(String key, Snapshot snapshot) {
    // 通过查找的弱引用创建ClassOb对象
    ClassObj refClass = snapshot.findClass(KeyedWeakReference.class.getName());
    if (refClass == null) {
        throw new IllegalStateException(
                "Could not find the " + KeyedWeakReference.class.getName() + " class in the heap dump.");
    }
    List<String> keysFound = new ArrayList<>();
    for (Instance instance : refClass.getInstancesList()) {
        List<ClassInstance.FieldValue> values = classInstanceValues(instance);
        Object keyFieldValue = fieldValue(values, "key");
        if (keyFieldValue == null) {
            keysFound.add(null);
            continue;
        }
        String keyCandidate = asString(keyFieldValue);
        // key值相等则找到内存泄露对象
        if (keyCandidate.equals(key)) {
            return fieldValue(values, "referent");
        }
        keysFound.add(keyCandidate);
    }
    throw new IllegalStateException(
            "Could not find weak reference with key " + key + " in " + keysFound);
}
findLeakingReference() 方法的主要作用是找出泄露对象:
- 在 snpashot 内存快照中找到泄露对象的弱引用;
- 遍历这个对象所有实例;
- 若这个 key 值和最开始定义封装 KeyedWeakReference 的 key 值相同,那么返回这个泄露对象。
HeapAnalyzer.findLeakTrace()
private AnalysisResult findLeakTrace(long analysisStartNanoTime, Snapshot snapshot,
                                     Instance leakingRef, boolean computeRetainedSize) {
    listener.onProgressUpdate(FINDING_SHORTEST_PATH);
    // 分析snpashot内存快照找出内存泄露的点,判断依据是GCRoot
    ShortestPathFinder pathFinder = new ShortestPathFinder(excludedRefs);
    // 查找泄露的最短引用链,这里只关注GCRoot的两种类型:1.静态;2.被其他线程使用并且其他线程正在运行没有结束
    ShortestPathFinder.Result result = pathFinder.findPath(snapshot, leakingRef);
    String className = leakingRef.getClassObj().getClassName();
    // False alarm, no strong reference path to GC Roots.(误报,没有强引用的GCRoots)
    if (result.leakingNode == null) {
        return noLeak(className, since(analysisStartNanoTime));
    }
    listener.onProgressUpdate(BUILDING_LEAK_TRACE);
    // 生成内存泄露调用栈
    LeakTrace leakTrace = buildLeakTrace(result.leakingNode);
    // 计算内存泄露空间大小
    long retainedSize;
    if (computeRetainedSize) {

        listener.onProgressUpdate(COMPUTING_DOMINATORS);
        // Side effect: computes retained size.
        snapshot.computeDominators();

        Instance leakingInstance = result.leakingNode.instance;

        retainedSize = leakingInstance.getTotalRetainedSize();

        // TODO: check O sources and see what happened to android.graphics.Bitmap.mBuffer
        if (SDK_INT <= N_MR1) {
            listener.onProgressUpdate(COMPUTING_BITMAP_SIZE);
            retainedSize += computeIgnoredBitmapRetainedSize(snapshot, leakingInstance);
        }
    } else {
        retainedSize = AnalysisResult.RETAINED_HEAP_SKIPPED;
    }

    return leakDetected(result.excludingKnownLeaks, className, leakTrace, retainedSize,
            since(analysisStartNanoTime));
}
findLeakTract() 方法的主要作用是找到最短泄露路径,计算泄露大小作为结果反馈。
HeapAnalyzerService.onHandleIntentInForeground()
protected void onHandleIntentInForeground(@Nullable Intent intent) {
    if (intent == null) {
        CanaryLog.d("HeapAnalyzerService received a null intent, ignoring.");
        return;
    }
    String listenerClassName = intent.getStringExtra(LISTENER_CLASS_EXTRA);
    HeapDump heapDump = (HeapDump) intent.getSerializableExtra(HEAPDUMP_EXTRA);
    // 创建过滤掉特定内存泄露的heapAnalyzer
    HeapAnalyzer heapAnalyzer =
            new HeapAnalyzer(heapDump.excludedRefs, this, heapDump.reachabilityInspectorClasses);
    // 检查内存泄露
    AnalysisResult result = heapAnalyzer.checkForLeak(heapDump.heapDumpFile, heapDump.referenceKey,
            heapDump.computeRetainedHeapSize);
    // 回调结果显示
    AbstractAnalysisResultService.sendResultToListener(this, listenerClassName, heapDump, result);
}
onHandleIntentInForeground() 方法的主要作用是检查内存泄露并通知回调结果显示。通过调用 AnalyzedHeap.save() 将之前的 .prof 文件保存为 .result 文件,然后将 .result 文件路径通过 intent 传到 DisplayLeakService(继承 AbstractAnalysisResultService,而 AbstractAnalysisResultService 是继承 ForegroundService)。
public static void sendResultToListener(@NonNull Context context,
                                        @NonNull String listenerServiceClassName,
                                        @NonNull HeapDump heapDump,
                                        @NonNull AnalysisResult result) {
    Class<?> listenerServiceClass;
    try {
        listenerServiceClass = Class.forName(listenerServiceClassName);
    } catch (ClassNotFoundException e) {
        throw new RuntimeException(e);
    }
    Intent intent = new Intent(context, listenerServiceClass);

    File analyzedHeapFile = AnalyzedHeap.save(heapDump, result);
    if (analyzedHeapFile != null) {
        intent.putExtra(ANALYZED_HEAP_PATH_EXTRA, analyzedHeapFile.getAbsolutePath());
    }
    ContextCompat.startForegroundService(context, intent);
}

### AbstractAnalysisResultService.onHandleIntentInForeground() ###
```java
protected final void onHandleIntentInForeground(@Nullable Intent intent) {
    if (intent == null) {
        CanaryLog.d("AbstractAnalysisResultService received a null intent, ignoring.");
        return;
    }
    if (!intent.hasExtra(ANALYZED_HEAP_PATH_EXTRA)) {
        onAnalysisResultFailure(getString(R.string.leak_canary_result_failure_no_disk_space));
        return;
    }
    File analyzedHeapFile = new File(intent.getStringExtra(ANALYZED_HEAP_PATH_EXTRA));
    AnalyzedHeap analyzedHeap = AnalyzedHeap.load(analyzedHeapFile);
    if (analyzedHeap == null) {
        onAnalysisResultFailure(getString(R.string.leak_canary_result_failure_no_file));
        return;
    }
    try {
        onHeapAnalyzed(analyzedHeap);
    } finally {
        //noinspection ResultOfMethodCallIgnored
        analyzedHeap.heapDump.heapDumpFile.delete();
        //noinspection ResultOfMethodCallIgnored
        analyzedHeap.selfFile.delete();
    }
}
onHandleIntentInForeground() 方法的主要作用是将 .result 文件生成 AnalyzedHeap 对象,之后调用 onHeapAnalyzed() 将 AnalyzedHeap 的信息通过 Notification 展示。
DisplayLeakActivity.onResume()
protected void onResume() {
    super.onResume();
    DisplayLeakActivity.LoadLeaks.load(this, getLeakDirectoryProvider(this));
}
onResume() 方法中使用了 LoadLeaks(实现了 Runnable 接口),并传入一个 Provider,这个 Provider 就是上面创建 .result 文件时所用到的 DefaultLeakDirectoryProvider,而在 load() 方法主要在线程池执行是读取 .result 文件,然后通过 UI Handler 将读取的信息更新 UI 中。DisplayLeakActivity 是平时用到的通过桌面入口进入的泄漏信息查看 Activity 在 AndroidRefWatcherBuilder.buildAndInstall() 方法中被开启实例化。
总结
LeakCanary 对于内存泄漏的检测非常有效,但也并不是所有的内存泄漏都能检测出来。
- 无法检测出
Service中的内存泄漏问题 - 如果最底层的
MainActivity一直未走onDestroy()生命周期(它在Activity栈的最底层),无法检测出它的调用栈的内存泄漏。